
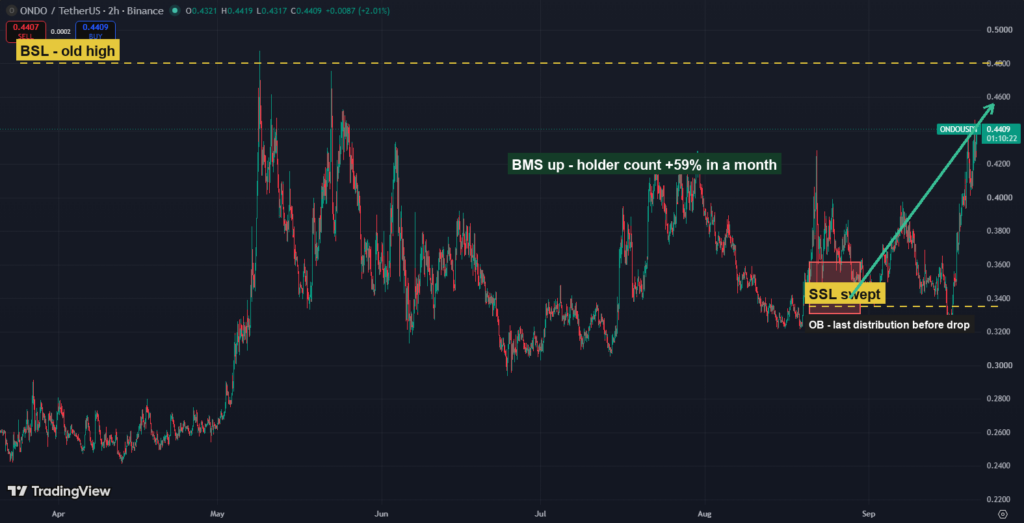
ONDO, 2H chart (TradingView, Binance): old-high liquidity swept, then a break of market structure up as holder count climbed 59% in a month.
Most retail traders watch price and volume and stop there. By the time a breakout shows up on a candlestick chart, the move behind it usually already happened on-chain, days or sometimes weeks earlier, in data that is sitting there in public the whole time. Almost nobody trading on price alone bothers to check it, which is a shame, because the signals below are not complicated and none of them require a paid terminal.
Here are five worth tracking, plus three real, recent cases where checking them would have told you something the price chart alone did not.
Holder count growth is the simplest of the five. When the number of unique wallets or accounts holding a token keeps climbing while price sits flat, new buyers are building a position quietly instead of chasing a pump, and that shift usually shows up in the data before the wider market notices. ONDO is a clean recent example. Per RWA.xyz, the independent registry for tokenized real-world assets, Ondo’s platform holder count hit 481,225 in mid-September, up 59.31% in 30 days, spread across 441 separate tokenized products from short-term Treasury funds to tokenized shares of Nvidia and MicroStrategy. What made it worth watching was not just the number itself. DefiLlama showed Ondo’s total value locked actually declining slightly over the same month even as protocol fees rose to $7.95 million and quarterly revenue climbed for a third straight quarter, from $13.26 million in Q1 to $18.22 million by Q3. Read together, that is a platform doing more with the capital already inside it, not one simply attracting fresh deposits, and it is exactly the kind of divergence a price chart alone will never show you.
Exchange netflows are the second signal, and they cut the opposite direction from holder count. When coins move off exchanges into private wallets, holders are signaling they plan to sit on the position rather than sell soon. Sustained negative net flow, more leaving exchanges than arriving, has historically preceded upward moves simply because it shrinks the pool of coins available to sell into a rally. It is worth checking specifically because it can contradict a holder-count signal that looks bullish on its own, and when the two disagree, that disagreement is itself information.
Open interest divergence is third, and this is where things get genuinely useful for separating a real move from a leverage-driven one. If price stays flat while open interest on perpetual futures keeps climbing, checkable in seconds on Coinglass, traders are opening new leveraged positions without pushing spot price anywhere yet, and that kind of imbalance rarely resolves quietly. The Raydium selloff on September 21 is a textbook case of what to look for here, just in the other direction. RAY fell roughly 10% in a single session, and Coinglass showed the decline landing almost identically across every venue with real futures volume: OKX down 10.16%, KuCoin 10.14%, Gate 10.18%, Bitget 10.11%. That kind of uniformity across independent order books is the signature of broad spot-led selling, not a squeeze. The tell was in the liquidation totals. OKX, the deepest RAY futures book, recorded just $19,550 in long liquidations and $22,610 in shorts against $24.74 million in open interest, and the 24-hour long-short ratio sat close to even at roughly 49/51. A genuine cascade chews through open interest fast and leaves liquidation totals far larger than that on a move this size. This one did not happen. The move was profit-taking after RAY had already run from $0.80 to a $1.90 high on real news (a StonkFun rewards program and new tokenized-stock listings including AMD and BlackBerry), not forced selling, and open interest data made that distinction obvious in a way the falling price candle alone did not.
Funding rate resets are the fourth signal. When funding flips from deeply positive, longs paying shorts, to near zero or negative after a stretch of heavy leverage, it usually means the overleveraged crowd already got flushed out, which clears the way for a cleaner move in either direction. Bitcoin’s reaction to the September 16 Fed rate hike is the case to study here, because it shows what a real squeeze looks like next to Raydium’s fake one. Coinglass recorded $530.9 million in total liquidations over 24 hours, and $470.55 million of that nearly eight dollars for every one dollar of longs was short positions getting forced closed as BTC ran 5.9% to about $80,800. Open interest across exchanges rose 7.9% to $146.5 billion on the move, meaning positions were being added, not just closed out, while Binance funding stayed a mild 0.0069% to 0.0085%, well under the usual 0.01% baseline that signals a genuinely crowded trade. That combination, real liquidation volume plus rising open interest plus funding that had not yet gotten dangerously hot, is what separates an early-stage squeeze with more room to run from a late-stage one about to snap back.
The fifth signal is whale wallet clustering: tracking whether large wallets tied to the same entity are accumulating in step, something a handful of small purchases from unrelated addresses will never show on its own. Grouped together through free tools that surface shared funding sources and known entity labels, the picture can change completely. Arweave’s 74% move over two days in September is the cautionary case for why this matters. Coinglass showed AR futures volume at $488 million against just $67 million in spot, a 7.3-to-1 ratio, with Binance’s AR/USDT perpetual volume up 895% in a day. But total liquidations over that same 24 hours came to only $1.89 million, with $1.16 million of that on the short side. A short squeeze needs a pile of forced liquidations feeding the move, and this was not that. Traders were buying with borrowed money by choice, which is a materially different (and more reversible) kind of risk than a squeeze, and one that generic wallet-clustering checks would have flagged as leverage-driven speculation rather than organic accumulation, well before the move gave back a chunk of its gains.
None of these five signals work alone, and none predict direction with certainty on their own. What they do, especially when checked against each other the way the Raydium, Bitcoin, and Arweave cases show, is give a trader a reason to trust or distrust a price move before reacting to the candle, instead of finding out the hard way after it already happened.

